
Understanding the report
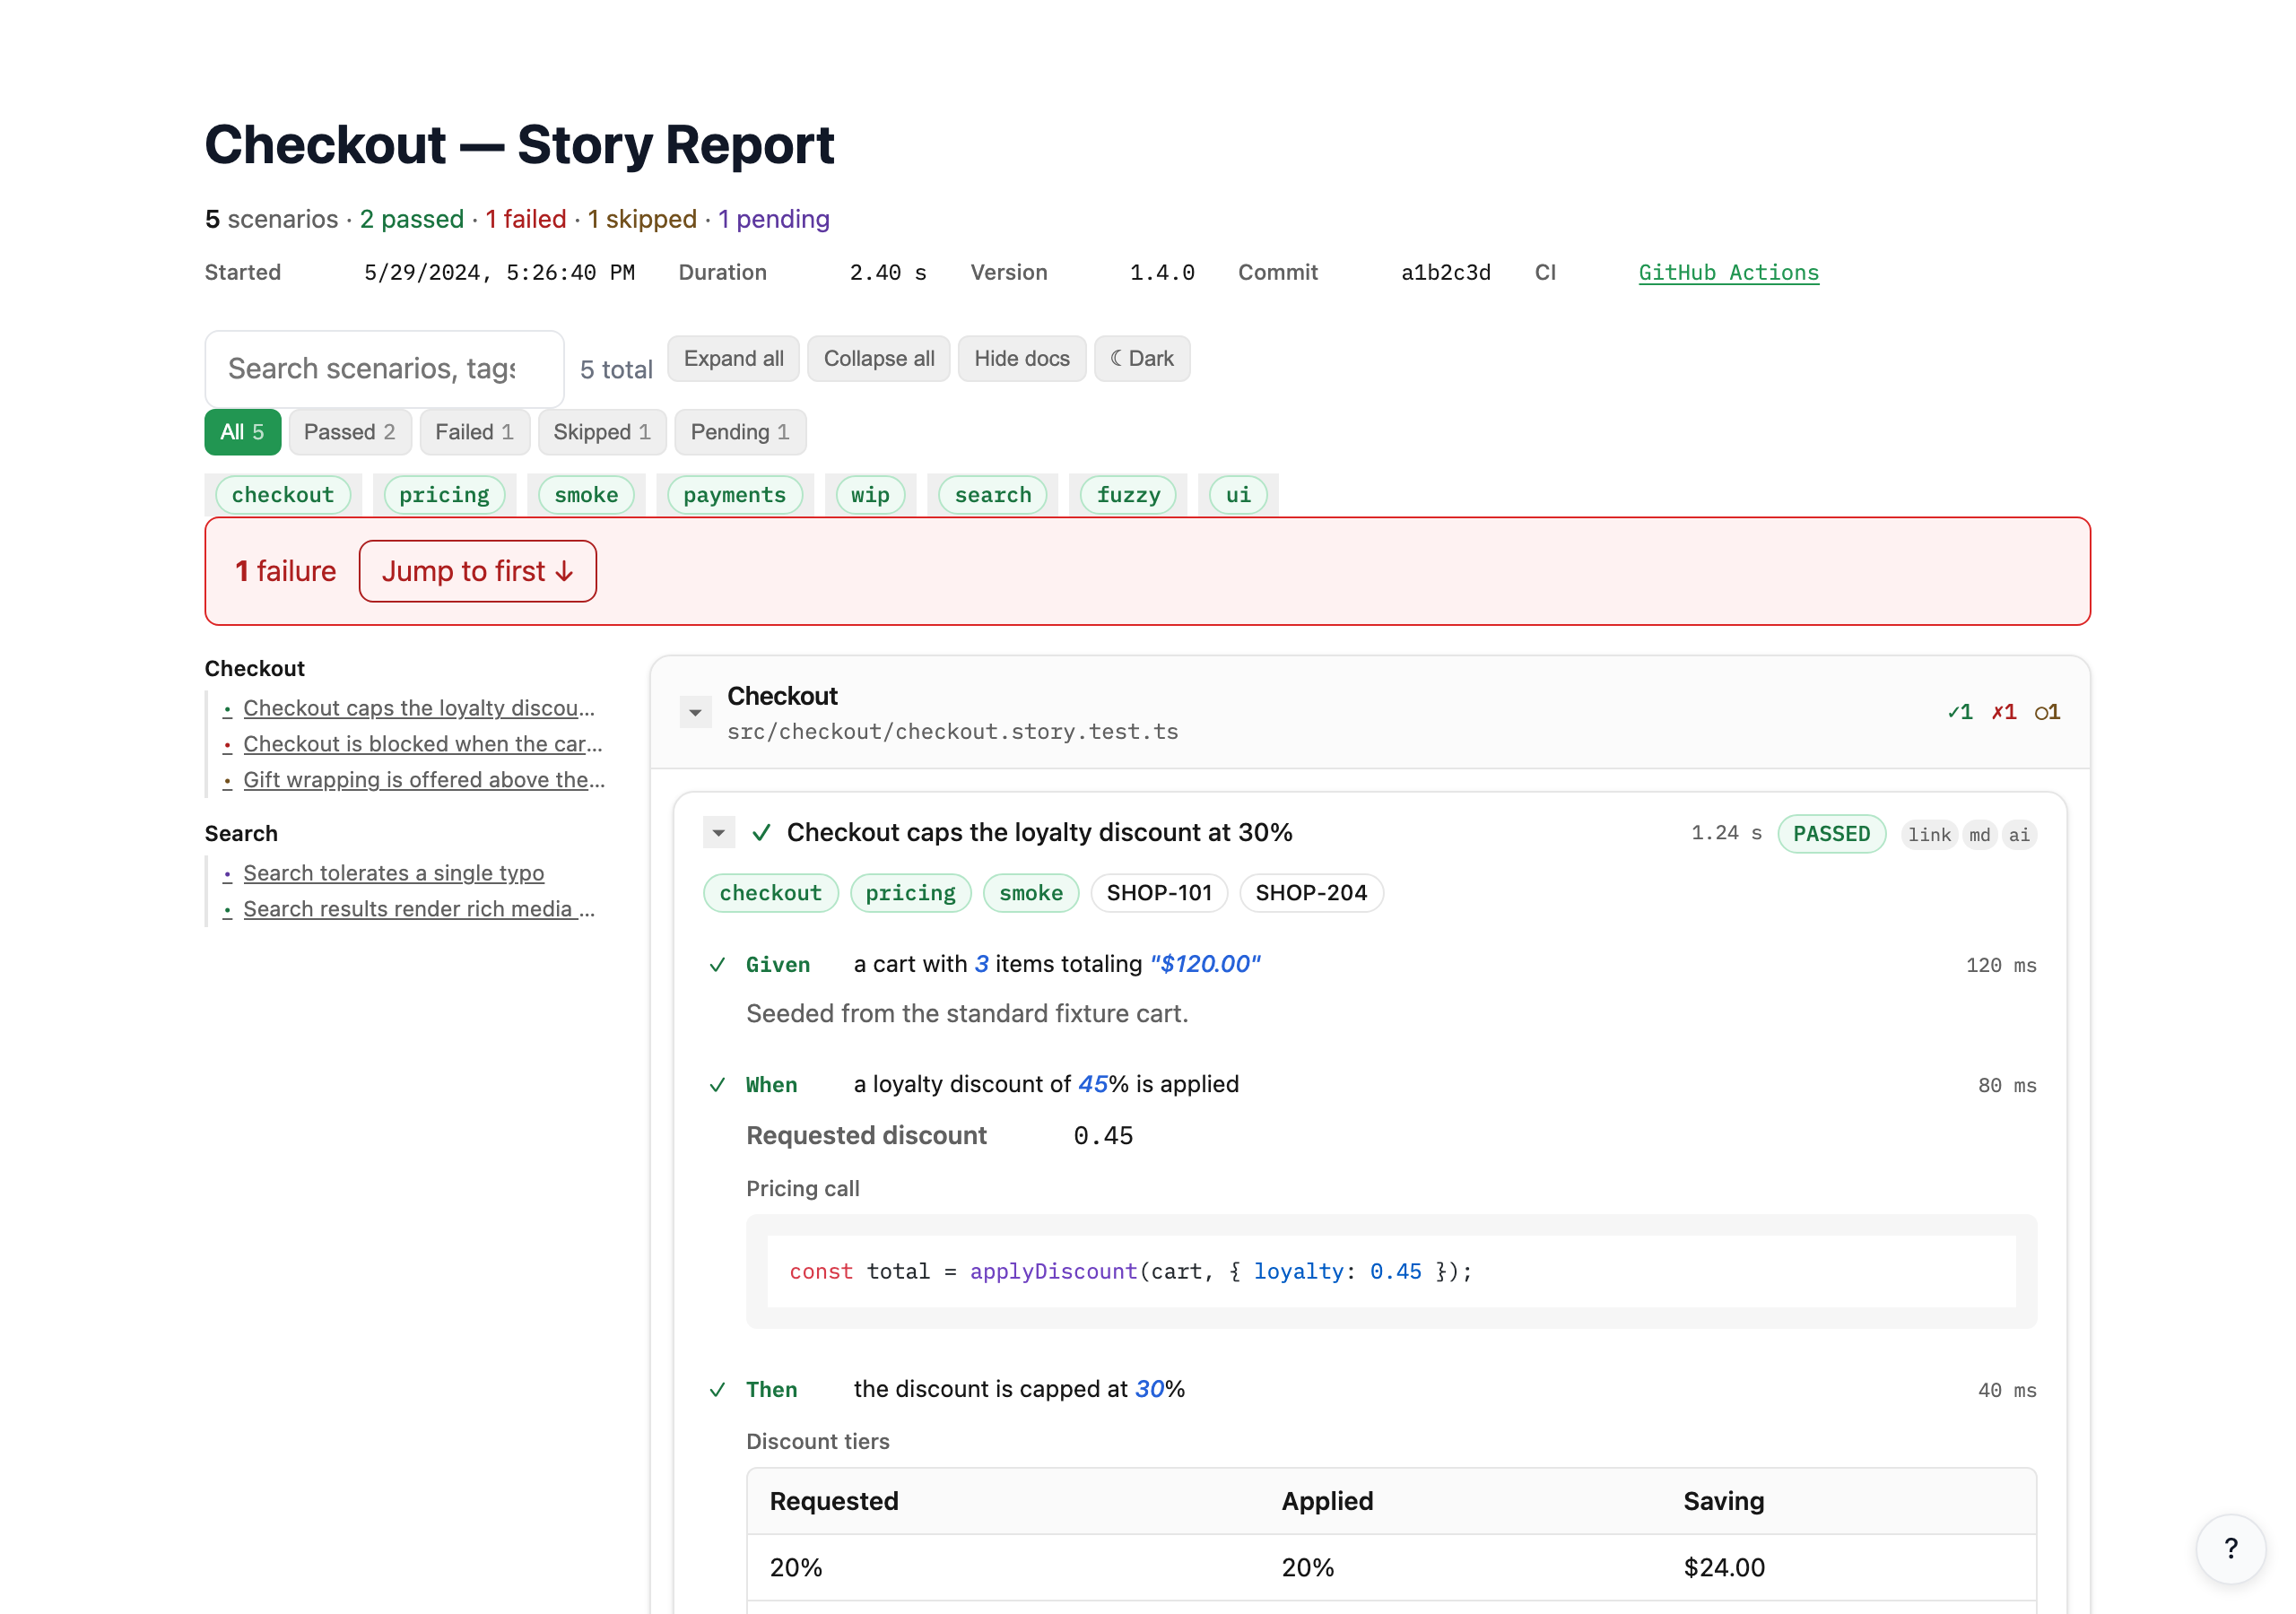
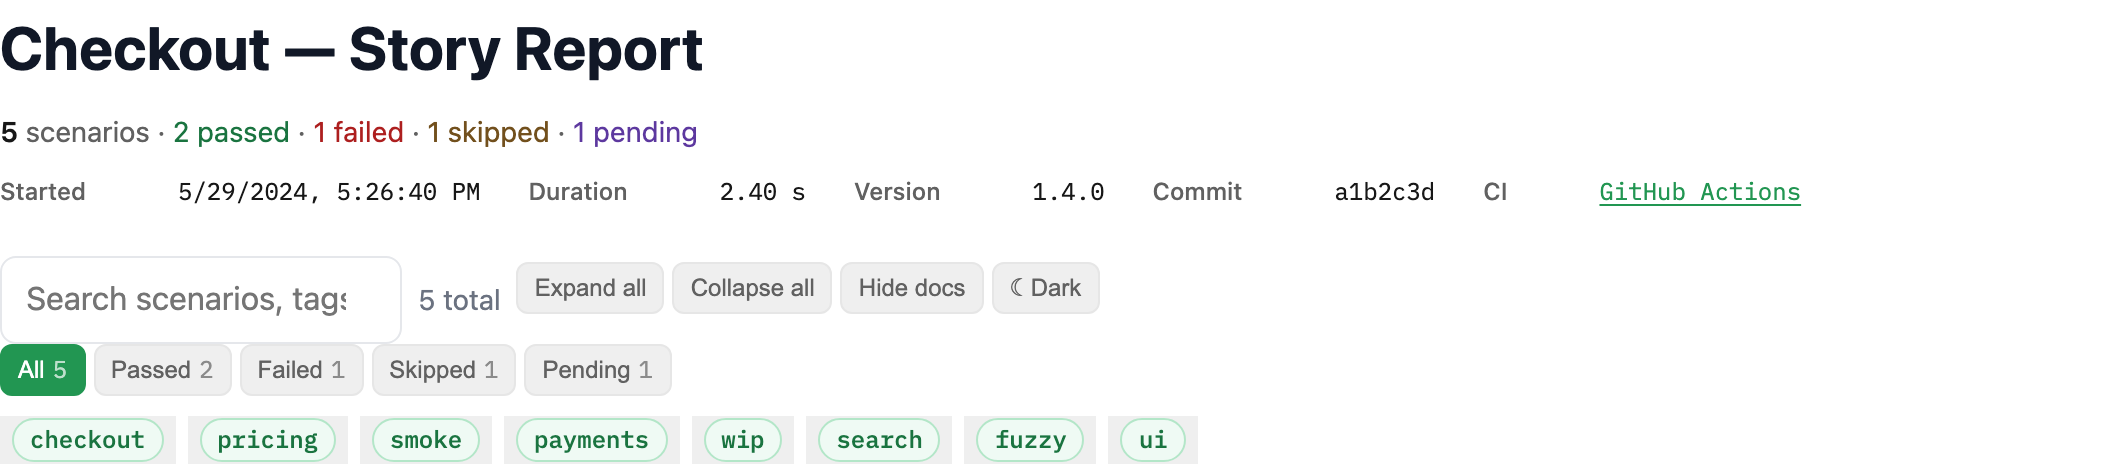
The reporter turns story metadata and test results into Markdown and HTML. Each scenario gets a status icon and optional headings, metadata, and source links.
Scenario status icons
Section titled “Scenario status icons”Scenarios show a status icon based on step results, with this precedence:
- ❌: Any step failed
- ✅: All steps passed
- 📝: All steps are todo (or fixme on Playwright)
- ⏩: All steps are skipped
- ⚠️: Mixed (e.g. some passed, some skipped)
So a scenario is marked failed if any step failed, even if others passed or were skipped.
Heading levels
Section titled “Heading levels”- When scenarios are grouped by file (default), each scenario title uses heading level 3 (
###). The file group uses level 2 (##). - When grouped by none (
groupBy: "none"), scenario titles use level 2 (##).
You can override with scenarioHeadingLevel / storyHeadingLevel in reporter options (see each framework’s reference).
What appears in the report
Section titled “What appears in the report”- Scenario title: The scenario heading normally comes from the test title used with
story.init(...). If you attach explicit story metadata in a framework-native pattern, that story title is what the report renders. - Steps: Each
story.given/story.when/story.then(andstory.and,story.but) as a bullet. Framework modifiers (skip/todo/fails etc.) are reflected in the step label (e.g. (skipped), (todo)). - Planned scenarios: Behavior you have specified but not built yet appears as a Planned scenario. Every adapter can emit one: bodyless
it.todo("title")(Vitest, Jest),test.fixme("title")(Playwright), bodylessit("title")(Cypress, via the Mocha reporter), and an explicitPlanned(...)/planned(...)call in Go, Ruby, Rust, pytest, JUnit 5, and xUnit. For the four JS reporters the file must also contain real story tests, so a suite full of todos never leaks into your docs; the explicit calls in Go, Ruby, Rust, pytest, JUnit 5, and xUnit record on their own. Markdown renders the heading with (planned); the HTML report shows a Planned badge instead of Pending. - Tags and options: If you pass
{ tags: [...], meta: {...} }tostory.init(..., options), they can be included (see reporter options). - Step documentation: Notes, key-value pairs, code blocks, tables, and links added via
story.note,story.json,story.table, etc. appear under the corresponding step. - Source link: If
permalinkBaseUrlis set (or in GitHub Actions with the built-in fallback), each scenario can get aSource: [file](url)line. - Storyboard: when two or more steps carry a screenshot (e.g. Playwright
await story.screenshot({ page, alt })after each step) or a state snapshot, the scenario opens with a horizontal filmstrip: one frame per step, captioned with the step keyword, each linking to the full detail under its step. Nothing to configure and nothing separately authored. The storyboard is derived from the step docs, so it appears in the HTML report and on Astro story pages alike. This is the view to show product owners: Given → When → Then as pictures, data, or both.

Inline documentation renders as semantic HTML. You author tables and diagrams in your test; the report draws them, so there are no image files to keep in sync:



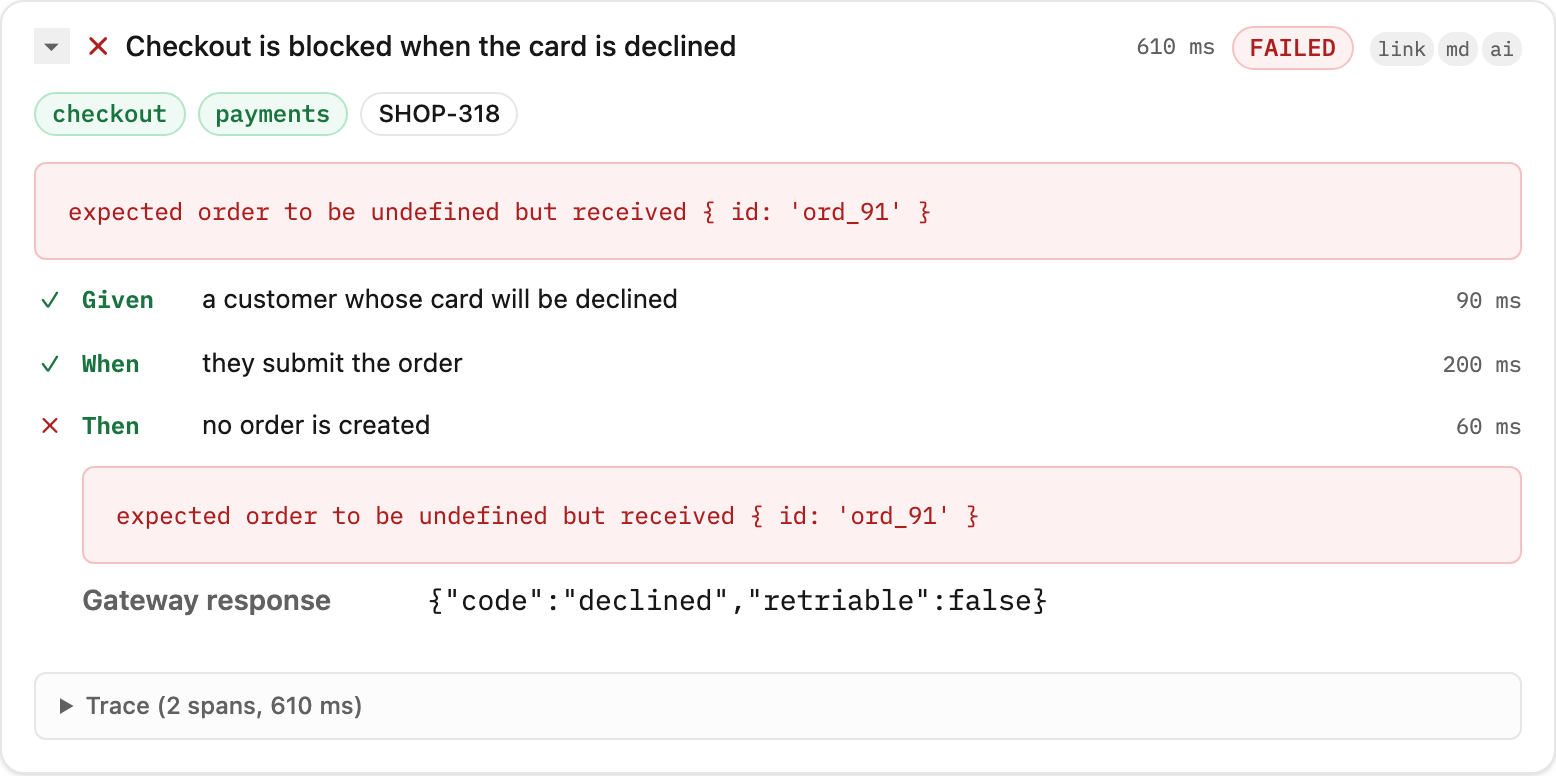
When a scenario fails, the report leads with the error and the step that failed:
State snapshots: storyboards for data
Section titled “State snapshots: storyboards for data”Storyboards are not screenshot-only. story.state({ label?, value }) captures
what the world looks like at a step as a JSON-serializable snapshot, and any
step carrying a state doc becomes a filmstrip frame, so API tests, domain
logic, and batch jobs get the same visual walkthrough UI code gets:
it('adding an item updates the basket total', ({ task }) => {  story.init(task);
  story.given('an empty basket');  const basket = createBasket();  story.state({ label: 'Basket', value: { items: [], total: 0 } });
  story.when('the shopper adds a hoodie');  basket.add({ sku: 'hoodie', price: 45 });  story.state({ label: 'Basket', value: { items: [{ sku: 'hoodie', qty: 1 }], total: 45 } });
  story.then('the total reflects the item price');  expect(basket.total).toBe(45);});
The report renders this diff-first:
- First appearance shows the snapshot. The first
Basketframe renders the full value (collapsed behind a summary in Markdown output). - Repeats show the change. Consecutive snapshots with the same label are
diffed at render time. The second frame reads
items[0].qty: added,total: 0 → 45, so the reader sees what the step did rather than two blobs to compare by eye. Diffs are derived, never stored, and never cross scenario boundaries. - Labels are lanes. Snapshot two entities (
BasketandOrder) and each label gets its own side-by-side lane in consistent order. A step can carry a screenshot and a state, putting the screen next to the backend record it proves.
The same frames feed the stakeholder surfaces:
- Journey pages (
journey:<id>tags) treat scenarios as chapters and show each chapter’s final state card, so a walkthrough ends every chapter with “here is what the world looked like”. - The
/statescatalog (state:<name>tags) gives non-UI scenarios data-card thumbnails, so the grid is no longer screenshots-only. One concept at two granularities: tags name states,story.state()shows them. See Tagging for your audience.
There is no size cap, but the JS adapters warn above ~100KB per snapshot.
Capture the business-relevant projection, not the ORM entity: { status, total, items } reads as documentation; forty persistence columns read as
noise. Done well, this makes the generated site the document of record for
how a feature behaves, the thing teams otherwise hand-maintain in Confluence
or TestRail, for backend behaviour as much as UI flows.
Claims that asserted nothing
Section titled “Claims that asserted nothing”Claim steps can carry an assertions count. Jest, Vitest, Playwright, and
Ruby/Minitest observe their framework’s live counter. Cypress, Go, Rust, pytest,
JUnit 5, and xUnit can only declare an assertion through their story wrapper.
- A positive count means the adapter observed or declared assertions for that step.
0means it observed that none ran.- An absent field means the host cannot observe assertion counts; it does not mean zero.
When every observable Then/And/But claim step has zero assertions, Markdown appends
_(no assertion)_ and HTML shows a No assertion badge. The CLI summary reports how
many passing scenarios asserted nothing, while Evidence Review grades those claims
none. This signal proves only that an assertion ran, not that it matched the sentence.
Run history in the interactive report
Section titled “Run history in the interactive report”When the CLI runs with --history-file (or the reporter is configured with history.filePath), the interactive HTML report layers run-over-run context on top of the current results:
- Per-scenario timeline: a dot per recent run on each scenario card (oldest → newest), with a tooltip summary like “8/10 runs passed · Passing for the last 5 runs”.
- Flaky badge: scenarios whose recent runs flip between pass and fail get a Flaky badge next to the timeline, so an unreliable scenario can’t hide behind a green run.
- “Since last run” strip: one line in the report header summarizing what changed against the previous run: newly failing scenarios (deep-linked), fixed scenarios, and first-seen scenarios. A quiet run says “no behavior changes” rather than nothing.
All of this is presentation-layer data derived from the history store; the StoryReport JSON contract is unchanged. See Run history in the CLI reference.
Since your last visit
Section titled “Since your last visit”The “since last run” strip above answers what the last run changed. Someone opening a report they last read a week ago is usually asking something else: what changed since they were here.
The interactive report remembers the scenario statuses each reader last saw and opens with one line, “Since your last visit (4 days ago): 2 started failing”, with each scenario deep-linked. It stays quiet for a first-time reader, for someone re-opening a run they have already seen, and for a new run that changed nothing they had seen.
That memory is per-browser: it lives in localStorage, never in the report file and never
on a server, so a report shared with ten people gives each of them their own delta and
carries none of it between them.
Finding a scenario, and handing off a failure
Section titled “Finding a scenario, and handing off a failure”The search box matches more than titles. A reader arrives with something from somewhere else: a ticket id from the tracker, a string out of a stack trace, a path from a pull request. So the query also matches scenario tags, step text, ticket ids, the failing scenario’s error message, and the source file of the feature.
On a red run the failure banner offers Copy N failures for an agent: every failing scenario’s steps, the failing step marked, and its error verbatim, numbered, in one paste. A red run is rarely one broken thing, and an agent handed all of them at once can see the shared cause that copying them one at a time hides.
Which scenarios cost the most time
Section titled “Which scenarios cost the most time”Every scenario records how long it ran, and Run details lists the five slowest, each deep-linked and timed. A suite that has quietly grown to twenty minutes usually owes it to two or three scenarios, and nothing else in a pipeline names them.
In CI, executable-stories check --max-duration <ms> turns that into a budget: scenarios
over it are named with their duration and location, and the run exits 5.
How fresh is each scenario
Section titled “How fresh is each scenario”A combined report covers your whole suite, whatever fraction of it you last ran: each test file owns a report and the combined view is built from all of them (see Output modes). So a freshly-rendered report can hold a scenario that has not run in a fortnight.
Rather than let those borrow the rendering run’s freshness, each scenario records when it last ran. Any older than the staleness threshold shows a Last ran N days ago badge on its card. Scenarios that ran in this run show nothing, since that is the normal case and a badge on every card would say nothing at all.
The threshold is --html-stale-after-days (7 by default); 0 turns the signal off. It is the same threshold behind the report-level freshness banner, applied per scenario. The metadata table also says when a report was built from more than one run, and over what span.
Read it as: a green scenario with a stale badge passed the last time it ran, which may be several commits before the code it covers changed.
Asking the report questions (WebMCP)
Section titled “Asking the report questions (WebMCP)”The report you hand a product owner is a page, and their agent lives in a browser. The interactive report registers WebMCP tools on document.modelContext, so that agent can ask about the run instead of reading the screen a pixel at a time.
Four reads, answered from the run already embedded in the page. No server, no filesystem, no MCP client:
list_scenarios: optionally filtered by status, tag, or source fileget_failing_scenarios: what broke, with the failing step and its messageget_feature_summary: counts per feature, for “how are we doing”get_scenario: one scenario by id or exact title
And one that changes what the reader is looking at:
filter_scenarios: sets the report’s search text, status and tag filters, exactly as if someone had typed and clicked. Omitted fields are left alone; an empty string,"all", or an empty array clears one.
When an agent filters the report, a strip appears above the scenario list saying so, with a Show all reset. There is no confirmation prompt, because filtering a read-only report is not worth a dialogue, but the reader is never left wondering why the page moved. Touch any filter yourself and the strip goes.
Every answer carries the run it came from: id, commit, branch, and its age in days. A report is a snapshot, and this is what stops an agent relaying a three-week-old failure as today’s news.
Each scenario also carries assertionState (asserted, unasserted, or unobserved) alongside per-step assertions counts. A scenario that is passed and unasserted ran and checked nothing, so an agent has no excuse for reporting it as proof. unobserved means the adapter has no assertion counter and is not the same claim.
Two limits worth knowing:
- Interactive reports only. The tools ship with the report’s hydration island. The embedded run JSON is written either way, so a report rendered without the island is still machine-readable at
#es-report-data. - Progressive. WebMCP is behind a flag or origin trial in Chrome and Edge, and absent everywhere else. Without
document.modelContextnothing registers, nothing is logged, and the report behaves exactly as it always has.
The four read tools mirror the MCP server’s names and payloads, so an agent learns one vocabulary whichever way it arrives. See the agent artifact contract for the differences that a browser forces.
Enabling or hiding elements
Section titled “Enabling or hiding elements”Reporter options (under markdown in framework reporter config) control what’s included:
- Status icons:
includeStatusIcons: true(default): show ✅❌⏩ etc. for scenario status. - Errors in Markdown:
includeErrors: true(default): include failure messages for failed scenarios. - Summary table:
includeSummaryTable: trueto add a table with start time, duration, and counts. - Metadata block:
includeMetadata,metadata.date,metadata.packageVersion,metadata.gitSha. - Source links:
includeSourceLinks: trueandpermalinkBaseUrl(or rely on GitHub Actions fallback).
See Vitest reporter options, Jest reporter options, and Playwright reporter options for the full list.